Using the Results of Capstone Analysis to Predict a Weather Outcome
Anthony G Nolan – G3N1U5
Warwick J. Graco ATO
ABSTRACT
In this paper the results of capstone analysis is applied to predict a weather outcome using a decision-tree model. It examines weather data of the capital cities of Australia in a 12 month period to see if the decision-tree models can predict rain in Sydney the next day. It produces a decision-tree model with the raw weather data for each capital city to make the predictions about this outcome. It also aggregates the raw data to provide a combined-city dataset. Finally, it combines and compresses the raw data for each city using capstone modelling. The capstone data for the cities is used to train another decision-tree model to see if this provides better predictions of rain in Sydney than those obtained from using single-city models and the combined-city model. The results of these comparisons and details of how capstoning works are provided in the paper
INTRODUCTION
Weather is a key factor that affects citizens in a variety of ways including as examples leisure activities, work attendance and moving from one location to another. It also impacts on shopping and use of health services. Adverse weather can be a risk to the community by threatening life and property.
In this paper weather is viewed as the current and predicted near future state of the atmosphere for a particular geographic area or location. In practicable terms, weather describes a series of environmental systems characterized by variables and measurements. These can be categorized according to their impact. For instance, the level of temperature, the speed and direction of the wind, the amount of light, moisture and the amount of solar radiation received at any time influence the weather in a particular place. This in turn can affect the behaviours of citizens.
This paper reports the results of an investigation into weather as a large-scale, complex system and how it influences meteorological conditions in a specific geographic location. Specifically it models the weather conditions in the capital cities in Australia to predict whether it will rain the next day in Sydney, New South Wales, Australia. The weather data for the capital cities used in this study include Perth West Australia, Adelaide South Australia, Darwin Northern Territory, Brisbane Queensland, Canberra Australian Capital Territory, Melbourne Victoria and Hobart Tasmania.
By using weather measurements such as wind, air pressure, sun shine hours, cloud cover, rain and evaporation in these various cities it enabled these datasets to be employed in a decision-tree model to predict the percentage probability of rain the next day in Sydney. This was done in three ways. The first was that the raw weather data from each capital city was used to predict this output. The second was to combine the raw weather data from all the capital cities bar Sydney to predict the output. The third was to combine and compress the data across these cities to predict the same output using a method called ‘capstone analysis’. How capstone works is explained below.
The remainder of this paper reports the results of using single-city data, combined-city and the capstone data to predict whether it would rain the next day in Sydney. The data used in the analysis is described first.
METHODOLOGY
Data The data set was taken from the Australian Bureau of Meteorology (BOM) website. This was for the period 1st November 2008 to 31st October 2009. The dataset contained 12 months of data, and has the following variables. Date, Day, Min Temp, Max Temp, Rain, Evaporation, Sunshine hours, Max wind gust (direction, Speed, Time), Then Temp, relative humidity, cloud cover, wind direction, wind speed and air pressure for 9am, and for 3pm (see

Figure 1 for an extract of the data that can be obtained from the BOM website).
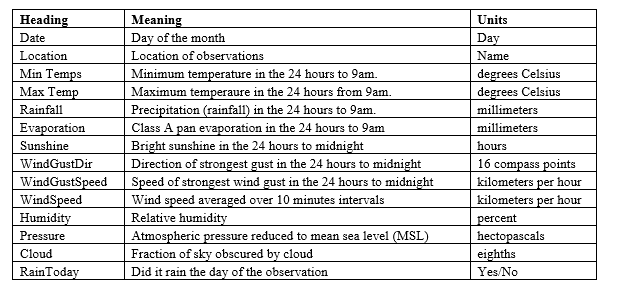
Capital-City Models The variables used for each capital city decision-tree model to produce the predictions for Sydney are listed in Table 1. These variables were converted to their raw values. For example, temperatures are converted from Celsius to Kelvin. The idea behind this was that where possible that numeric variables should have a ratio scale with a true zero so all variations between observations are a true representation of their movements. Table 1. Weather Variables
A binary target variable was added to the extracted BOM datasets to indicate if there was rain on each day of the one year period that was covered for Sydney. These converted datasets were used as inputs in a decision-tree model to predict if it will rain the next day.
The level of moisture had to be > 1mm for it to be judged that it had rained that day. This cut-off was selected to allow for days where there were frosts or heavy dews but no rain.
Capstone Analysis
Capstone Model (see Figure 2 for an example with weather) is a hierarchy of networked models where a small change in a lower model can have a cascading effect on the models higher up the hierarchy. There are parent-child relationships between models in the hierarchy. The basic challenge is how to represent data in a cause and effect framework which has multiple sources, that exists at different levels, and has dynamic properties. The capstone model employed in this study enables these issues to be accommodated in the modelling process and be selfadjusting and dynamic across the entire model structure. This is the approach used to predict the weather in Sydney.
In terms of how capstone analysis was applied to the weather data for the capital cities, the data for temperature, moisture and wind as examples for each day in each city was transformed using the peer relativity transformation formula described at Attachment 1 to this paper. This rescales the observations between 0 and 99. The rescale is determined by using the maximum value and the minimum value for that measurement within the Australian recorded weather observations. This provides a uniform rescale for all measurements.